

Clicks don't tell you whether your marketing is working.
B2B buyers rarely see an ad, click it, and immediately become a customer.
They see your company. They recognize your brand. They discuss you internally. They return through other channels. And weeks or months later, an opportunity appears in your CRM.
Traditional advertising reports often lose everything that happened before that conversion.
Revenue Reporting connects company-level advertising exposure with your CRM, so you can see what happens after the impression.


Traditional ad reporting
Impressions and clicks
CTR and CPM
Form submissions
Last-click conversions
Marketing data separated from CRM data
Difficult to explain impact to leadership
Revenue Reporting with Sid
Companies influenced
Deals influenced
Influenced pipeline
Influenced revenue
Advertising engagement connected to CRM data
Marketing reporting tied to commercial outcomes
REVENUE REPORTING
PIPELINE
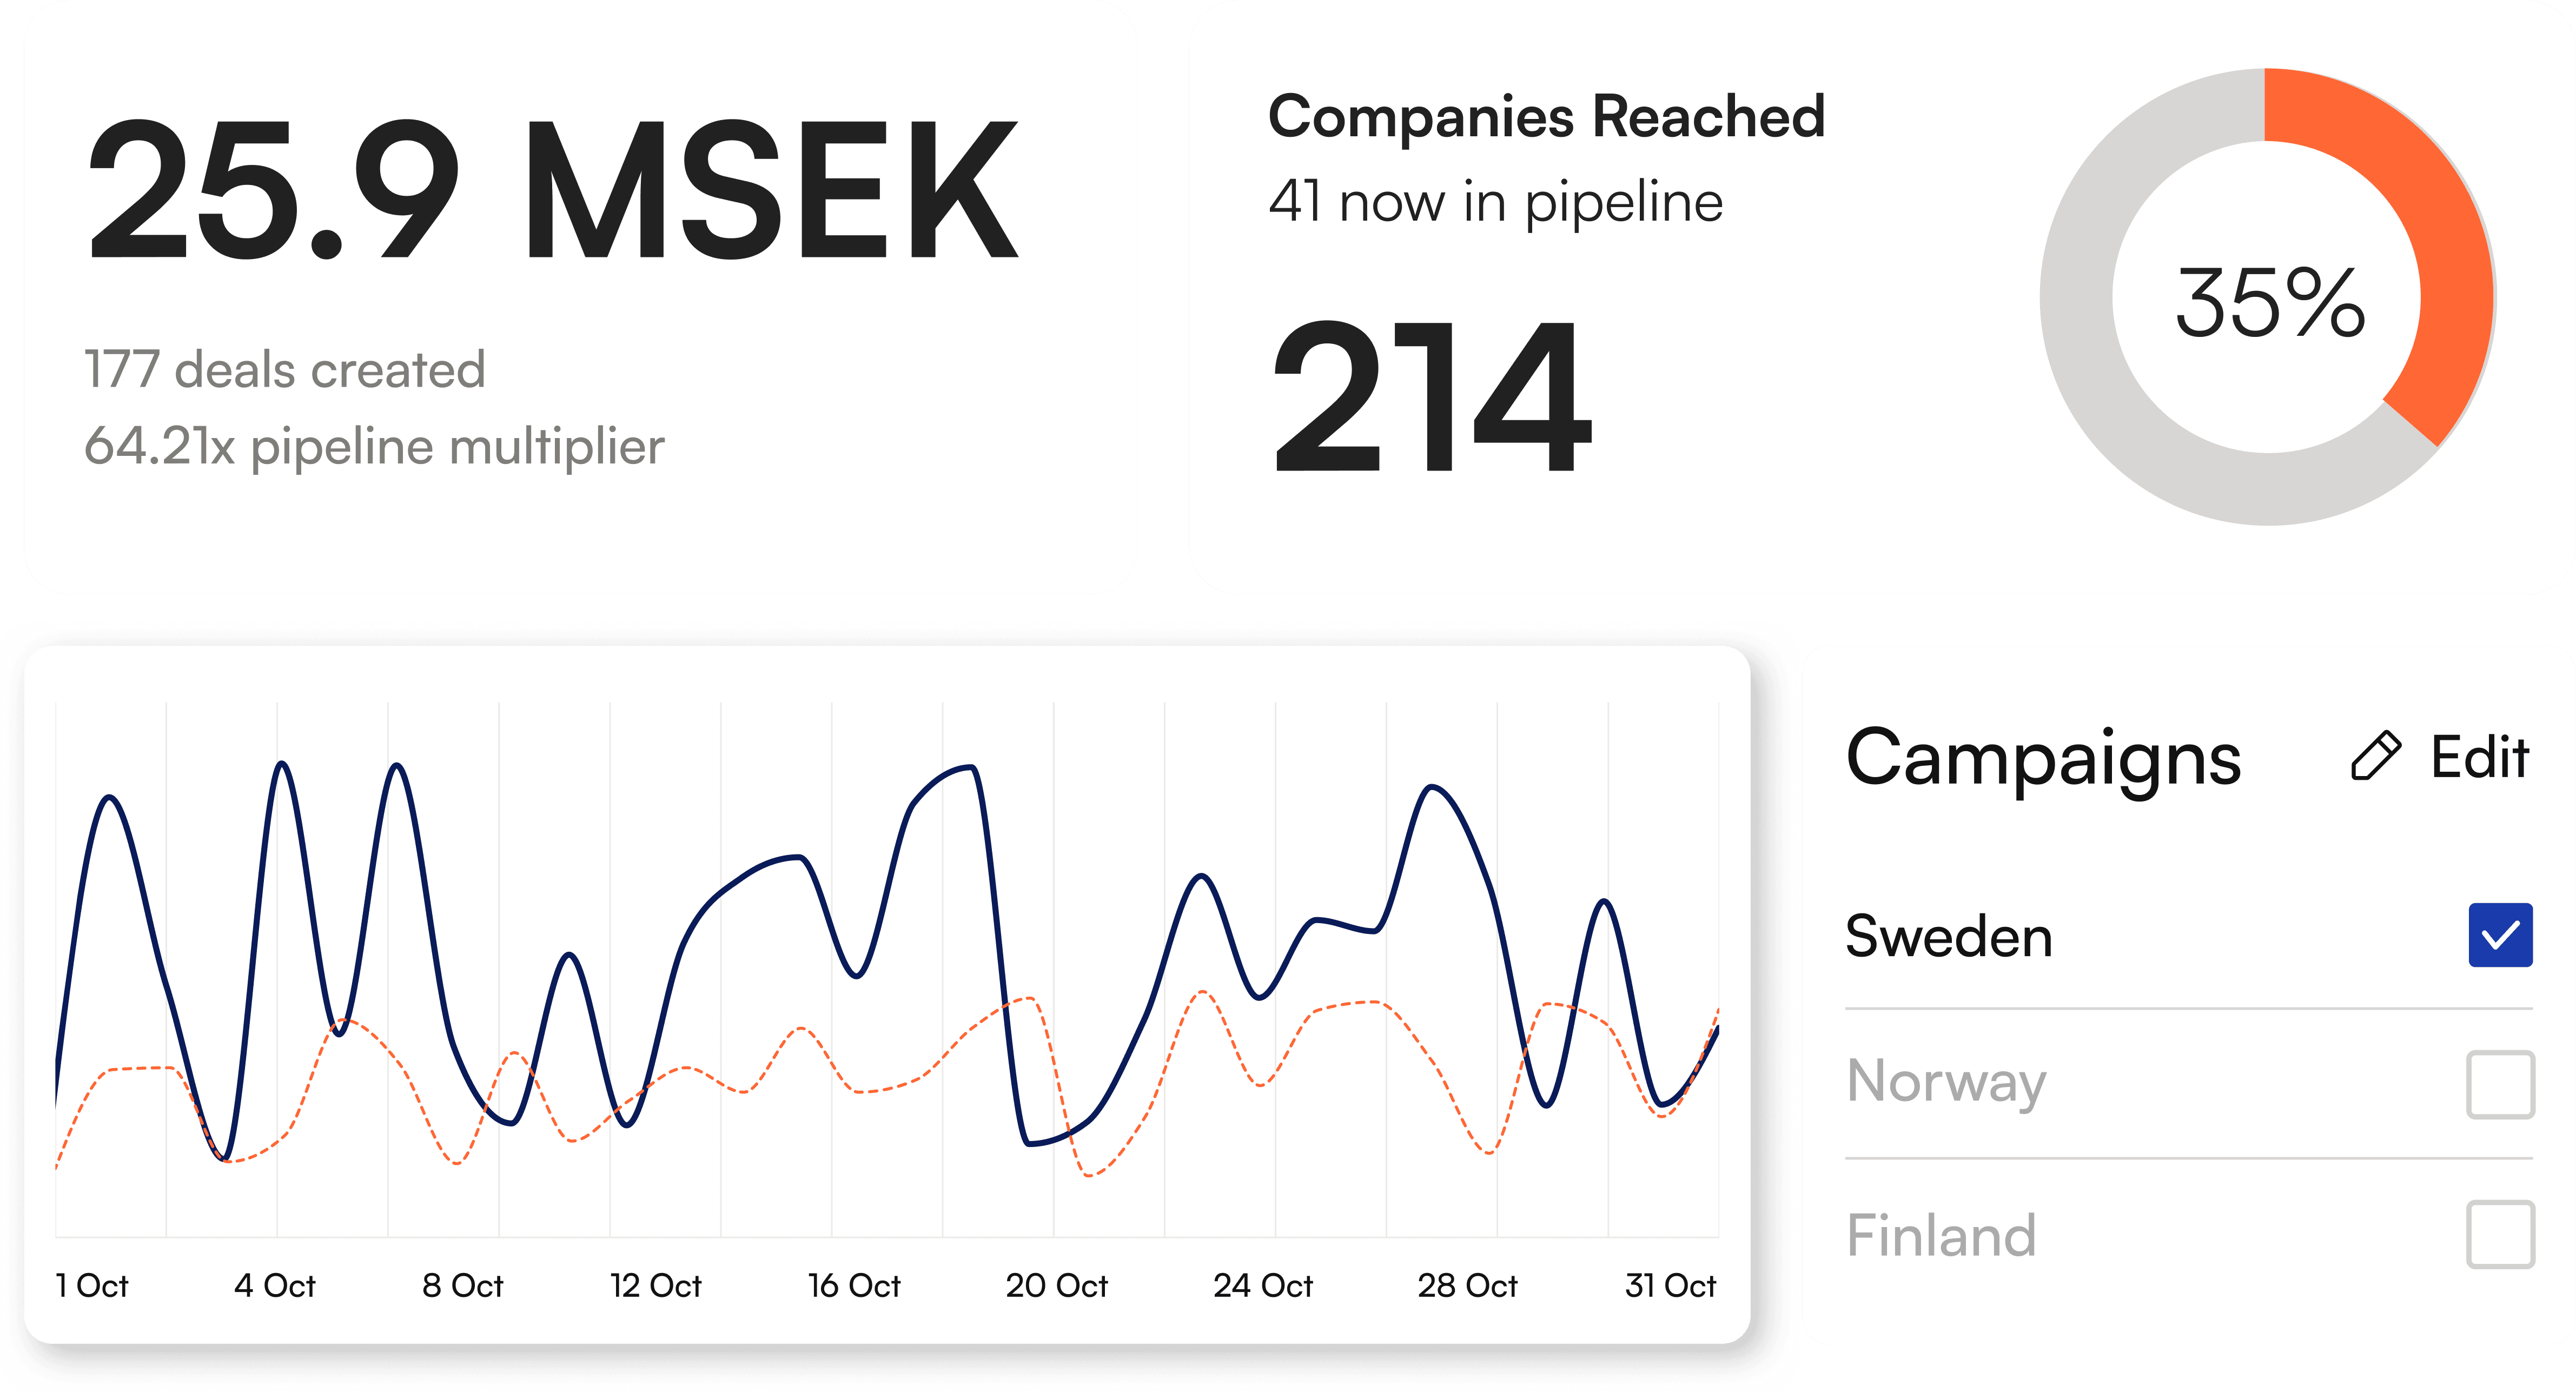
See which pipeline your advertising touched.
Know which companies in your pipeline were already being reached by your advertising. Sid connects advertising exposure at the company level with opportunities in your CRM, giving you visibility into how much of your active pipeline has been influenced by your campaigns.
Instead of asking "How many leads did our ads generate?", start asking "How much of our pipeline had already been exposed to our marketing?"

REVENUE REPORTING
CLOSED-WON
Follow influence all the way to closed revenue.
Pipeline is only part of the story. When influenced opportunities become customers, Sid helps you connect that revenue back to the advertising exposure that happened earlier in the buying journey.
See how much closed-won revenue comes from companies your campaigns reached, giving Marketing a clearer view of its contribution beyond lead generation.
REVENUE REPORTING
COMPANY VISIBILITY
Know which companies your ads are actually reaching.
B2B deals happen between companies, not ad-platform conversion events. Sid tracks advertising exposure at company level, helping you understand which accounts are seeing and engaging with your campaigns before they ever become a lead.
Impressions → Engagement → Clicks → Pipeline → Revenue
From first exposure to closed deal, see exactly where each account stands, not just whether they clicked.


HUBSPOT INTEGRATION
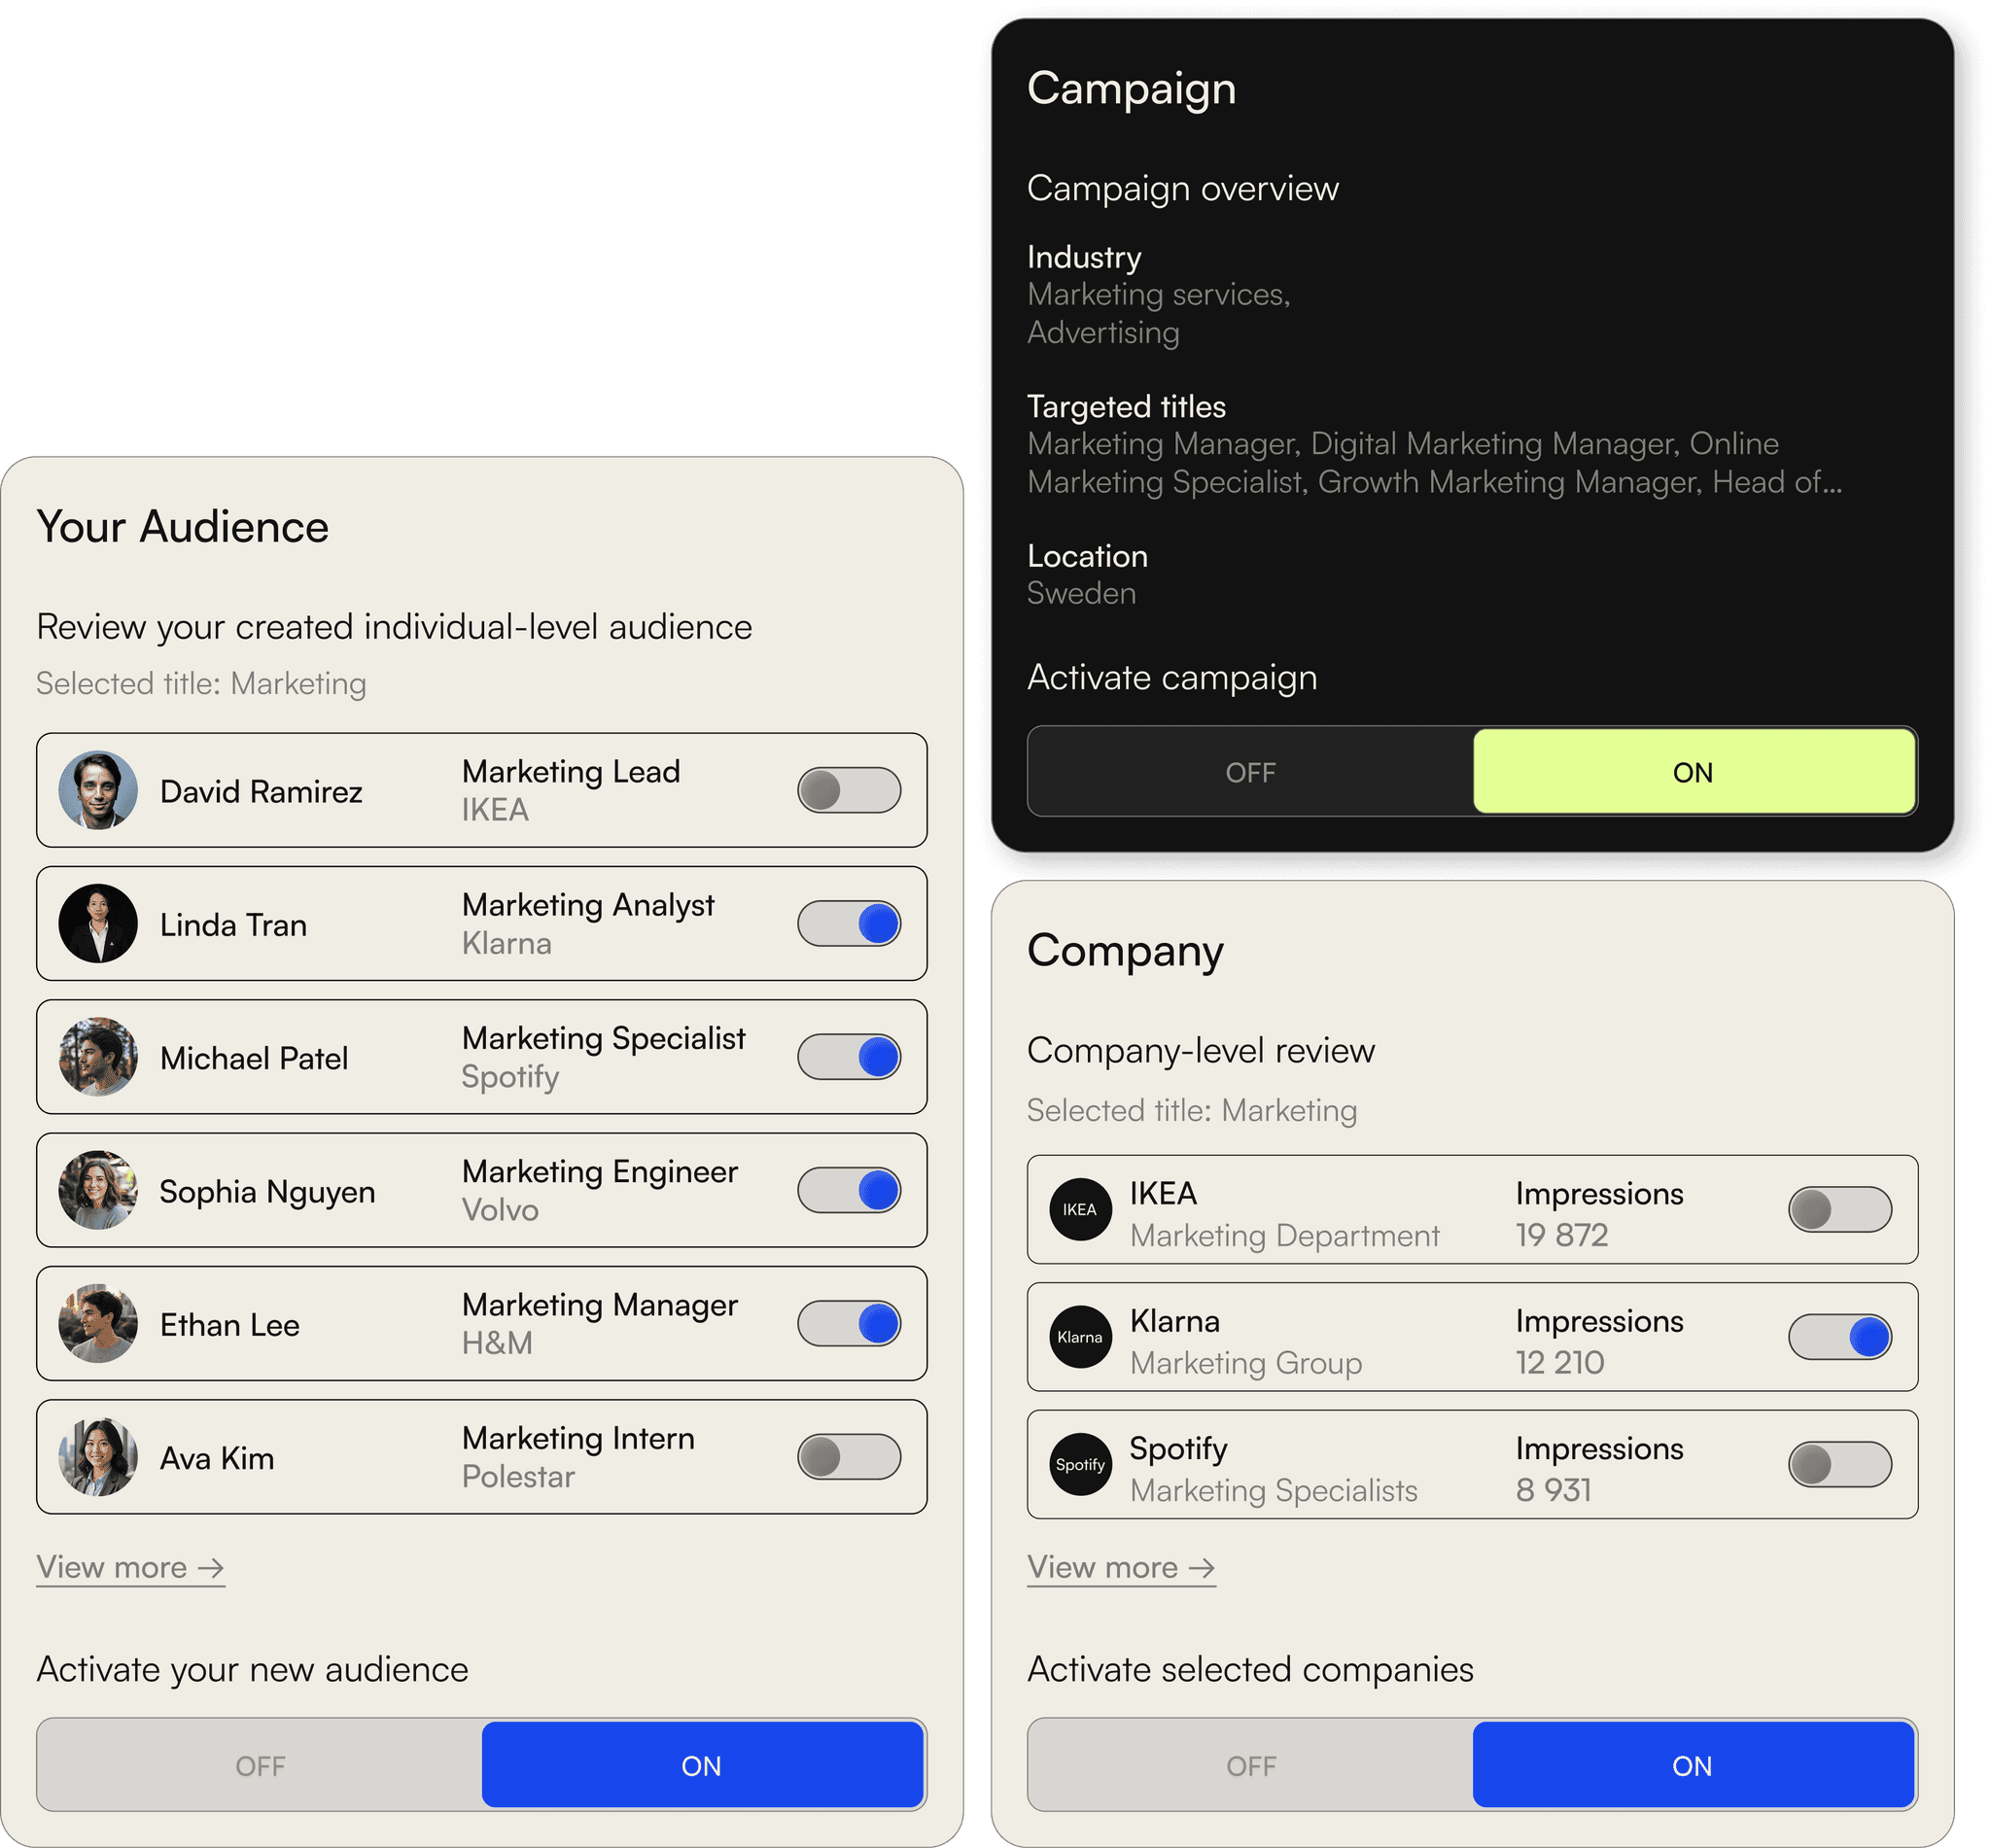
Everything, right where your sales team already works.
Sid syncs advertising engagement data directly into HubSpot at the company level. No separate dashboard to check, no extra login.
Your sales team sees exactly which companies have been exposed to your marketing, how engaged they are, and how that connects to the opportunities they're already working.
Every deal starts long before it reaches your CRM. Here's the journey Revenue Reporting follows.
01
Ad impression
Your target account starts seeing your advertising.
02
Repeated exposure
Decision-makers grow familiar with your company.
03
Engagement
People within the account interact with your campaigns.
04
Opportunity created
The company enters your CRM pipeline.
05
Deal won
The opportunity converts into revenue.
REVENUE REPORTING
Advertising and CRM data have always lived apart. Sid connects the two, so you can finally see how marketing activity turns into pipeline and revenue.
Advertising knows:
->
Companies reached
->
Impressions
->
Engagement
->
Clicks
->
Campaign activity
Your CRM knows:
->
Companies
->
Opportunities
->
Pipeline
->
Deal stages
->
Revenue
REVENUE REPORTING
Reporting built for B2B revenue teams.
Prove marketing's contribution
Move conversations away from CTR, CPM and lead volume and toward the metrics leadership cares about: pipeline and revenue.
Understand what happens before conversion
Capture company-level advertising exposure that traditional lead attribution often misses.
Align Marketing and Sales
Give both teams visibility into which accounts are being influenced and which of those accounts are moving through the pipeline.
From impression to revenue.
01
Connect your CRM
Connect HubSpot to Sid to bring your advertising and revenue data together.
02
Sid tracks company-level advertising activity
See which companies are being reached and how they interact with your campaigns.
03
Match influenced companies with your pipeline
When an exposed company is associated with an opportunity, Sid connects the advertising activity with the CRM deal.
04
Track influenced pipeline and revenue
See which opportunities were influenced, their pipeline value and which eventually became closed-won revenue.

Influence, not artificial attribution.
B2B buying journeys are complex. One ad rarely causes a multimillion-dollar deal, and Revenue Reporting isn't designed to pretend otherwise.
Instead, Sid shows you whether your marketing was present inside the companies that later became pipeline and revenue, giving you a measurable view of marketing influence throughout long sales cycles.
Answer the questions that actually matter.
On reach
Are our campaigns reaching companies that later become opportunities?
See how many companies in your pipeline were exposed to your advertising beforehand.
On reach
Are our campaigns reaching companies that later become opportunities?
See how many companies in your pipeline were exposed to your advertising beforehand.
On targeting
Is our marketing reaching the right companies?
Compare the companies being reached with the companies appearing in your actual pipeline.
On timing
How long does it take for advertising to show up as pipeline?
See the typical time between first exposure and an opportunity appearing in your CRM.




FAQ
Connecting advertising to pipeline and revenue raises a few natural questions. Below are answers to what we hear most often from B2B marketing and sales teams.
What is influenced pipeline?
Influenced pipeline is the total value of CRM opportunities associated with companies that were exposed to your marketing before or during their buying journey.
It provides a way to measure whether your marketing is reaching the accounts that eventually become commercial opportunities.
What is influenced revenue?
Influenced revenue is closed-won revenue associated with companies that were previously exposed to your marketing activity.
Is influenced pipeline the same as attribution?
No. Attribution attempts to assign credit for a conversion or deal to specific marketing touchpoints.
Influenced pipeline answers a different question, was marketing present in this account's buying journey?
For long B2B sales cycles involving multiple stakeholders and touchpoints, both can be useful, but they answer different questions.
Can Sid send LinkedIn Ads data to HubSpot?
Yes. The HubSpot integration allows company-level advertising metrics including impressions, engagement and clicks to be visible directly in HubSpot.
Does Revenue Reporting only measure leads?
No. Sid focuses on company-level advertising exposure, allowing you to understand marketing influence even when the eventual opportunity didn't originate from an advertising form submission.